Olympic Track & Field Body Composition: Event-Level Patterns
health analytics
sports analytics
R projects
data science
R
data visualization
data wrangling
Height–weight patterns of Olympic track and field medalists by event, using #TidyTuesday data (2021-07-27).
Author
Oliver F. Anderson, MS
Published
February 5, 2023
Keywords
TidyTuesday, R, ggplot2, sports analytics, Olympics, track and field, body composition, data visualization
Track and field athletes bring different body types to their events, and those differences often reflect the physical demands of each discipline. In this project, I analyzed medalists from Olympic track and field using the TidyTuesday dataset (July 27, 2021). The goal was to explore how height and weight vary across events and to see whether distinct patterns emerge between sprinters, distance runners, jumpers, and throwers.
Filtered for track and field (athletics) medalists.
Converted sex to a factor and standardized column labels for clarity.
Initial exploration
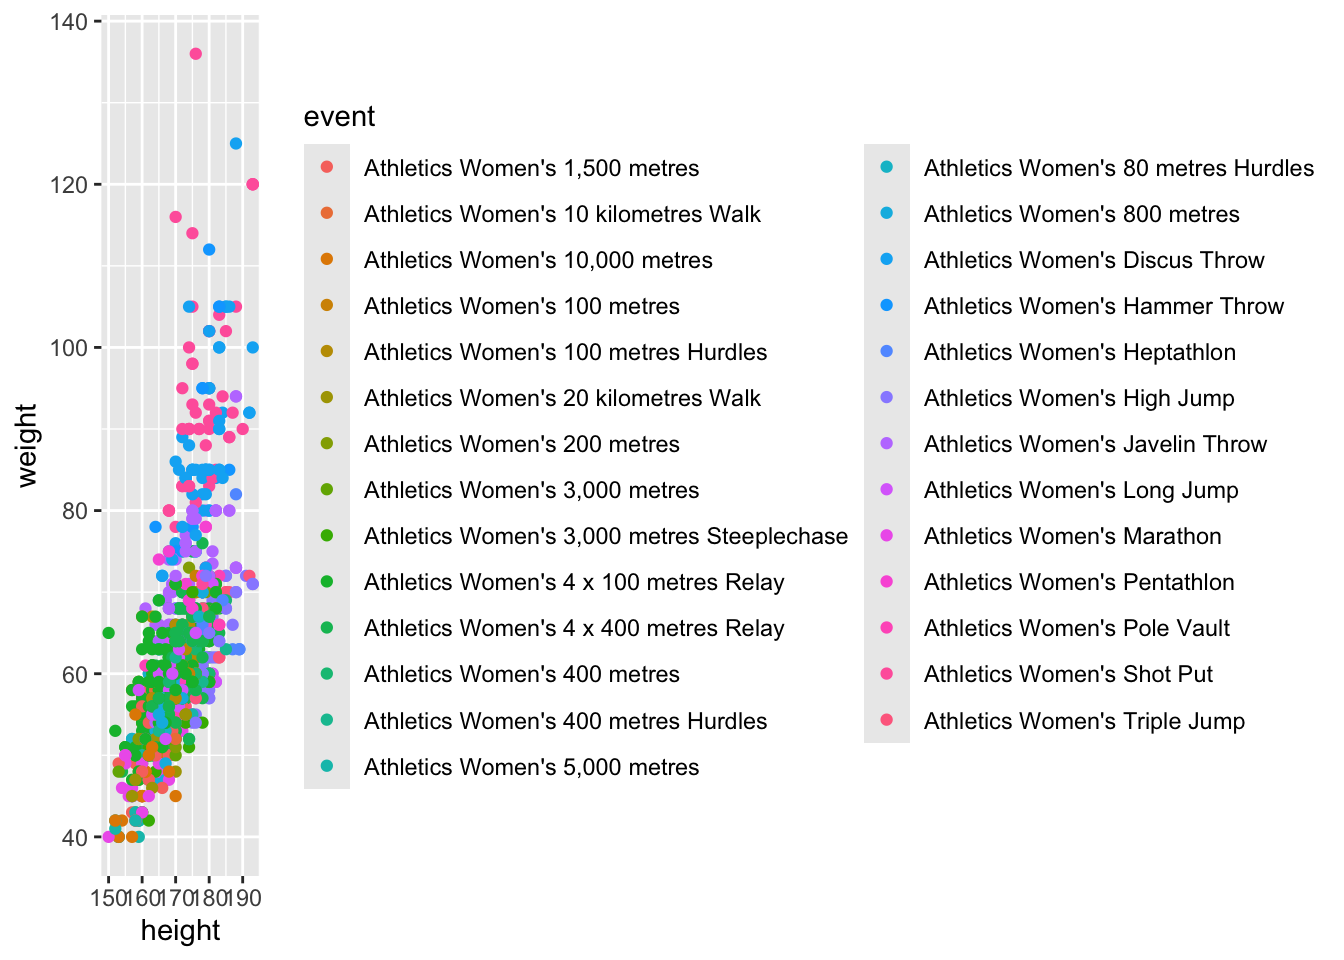
Plotted raw height and weight values by event to get a sense of variation.
Noticed dense overlaps across events, suggesting the need for grouping.
Group events into categories
Distance: 5,000 m, 10,000 m
Mid-distance: 800 m, 1,500 m
Sprints: 100 m, 400 m
Jumps: long jump, triple jump, high jump
Throws: shot put, discus, javelin
Subset by sex
Created separate data frames for female (athletics_f) and male (athletics_m) athletes.
Allowed for side-by-side comparison of body composition trends.
Refine visualizations
Built scatterplots of height vs. weight, colored by event category.
Applied transparency (alpha) to handle overlapping points.
Improved readability with theme_minimal() and color palettes from colorspace.
Final output
Produced two plots: one for female medalists, one for male medalists.
Code & Results
Look at the code
# load packages and read in data from tidyTuesdaylibrary(tidyverse)library(colorspace)library(patchwork)library(DT)olympics <- readr::read_csv('https://raw.githubusercontent.com/rfordatascience/tidytuesday/master/data/2021/2021-07-27/olympics.csv')# head(olympics)# I am interested in looking at track and field (athletics) medalistsathletics <- olympics %>%filter(sport=="Athletics",!is.na(medal))athletics$sex <-as.factor(athletics$sex)athletics_colnames <-c("ID", "Name", "Sex", "Age", "Height","Weight", "Team", "NOC", "Games", "Year","Season", "City", "Sport", "Event","Medal")DT::datatable(athletics, colnames = athletics_colnames, caption = htmltools::tags$caption(style ="caption-side: bottom; text-align: center;", htmltools::strong("Table 1: Olympic Track & Field Medalists")), filter ="top", options =list(pageLength =5, autoWidth =TRUE))
After filtering the data to focus on track and field medalists, I separated the athletes by sex and visualized their height and weight across different events.
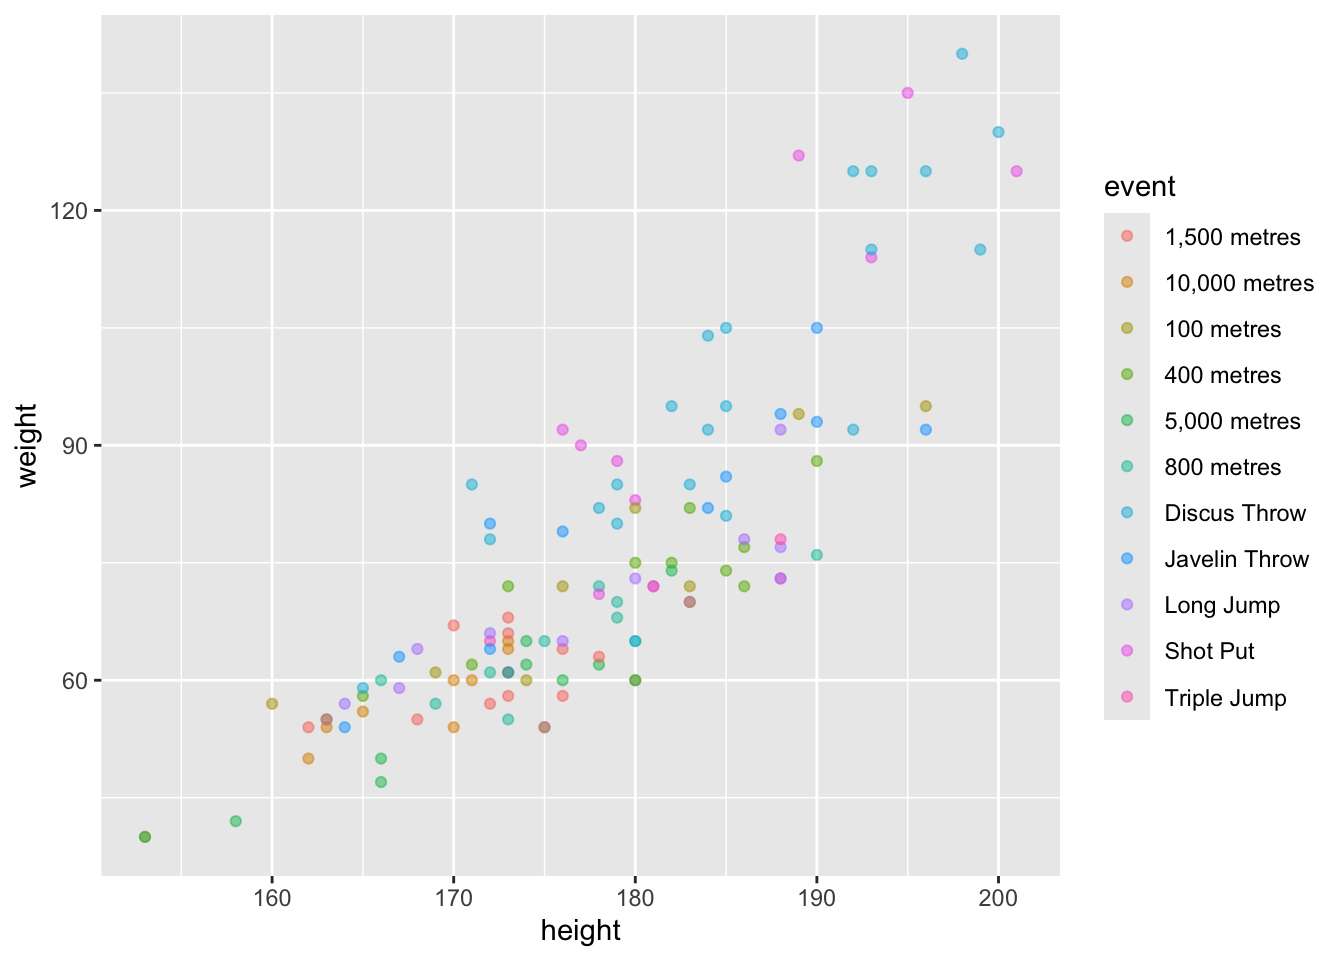
To simplify the analysis, I selected a few events and grouped them into categories such as Distance, Mid-Distance, Sprints, Jumps, and Throws. I then refined the visualizations, resulting in a cleaner and more understandable plot.
Look at the code
# there are so many events so lets choose a few events that represent some categories# distance: 10k, 5k# mid-distance: 800m, 1500m# sprints: 100m, 400m# jumps: long jump, triple jump# throws: shot put, discus, javelinathletics$event <-gsub("Athletics Women's ", "", athletics$event)athletics$event <-gsub("Athletics Men's ", "", athletics$event)athletics <- athletics %>%filter(event ==c("10,000 metres", "5,000 metres", "800 metres","1,500 metres", "100 metres", "400 metres", "Long Jump", "Triple Jump", "Shot Put", "Discus Throw", "Javelin Throw"))athletics %>%ggplot(aes(height, weight, color=event))+geom_point(alpha=0.5)
Look at the code
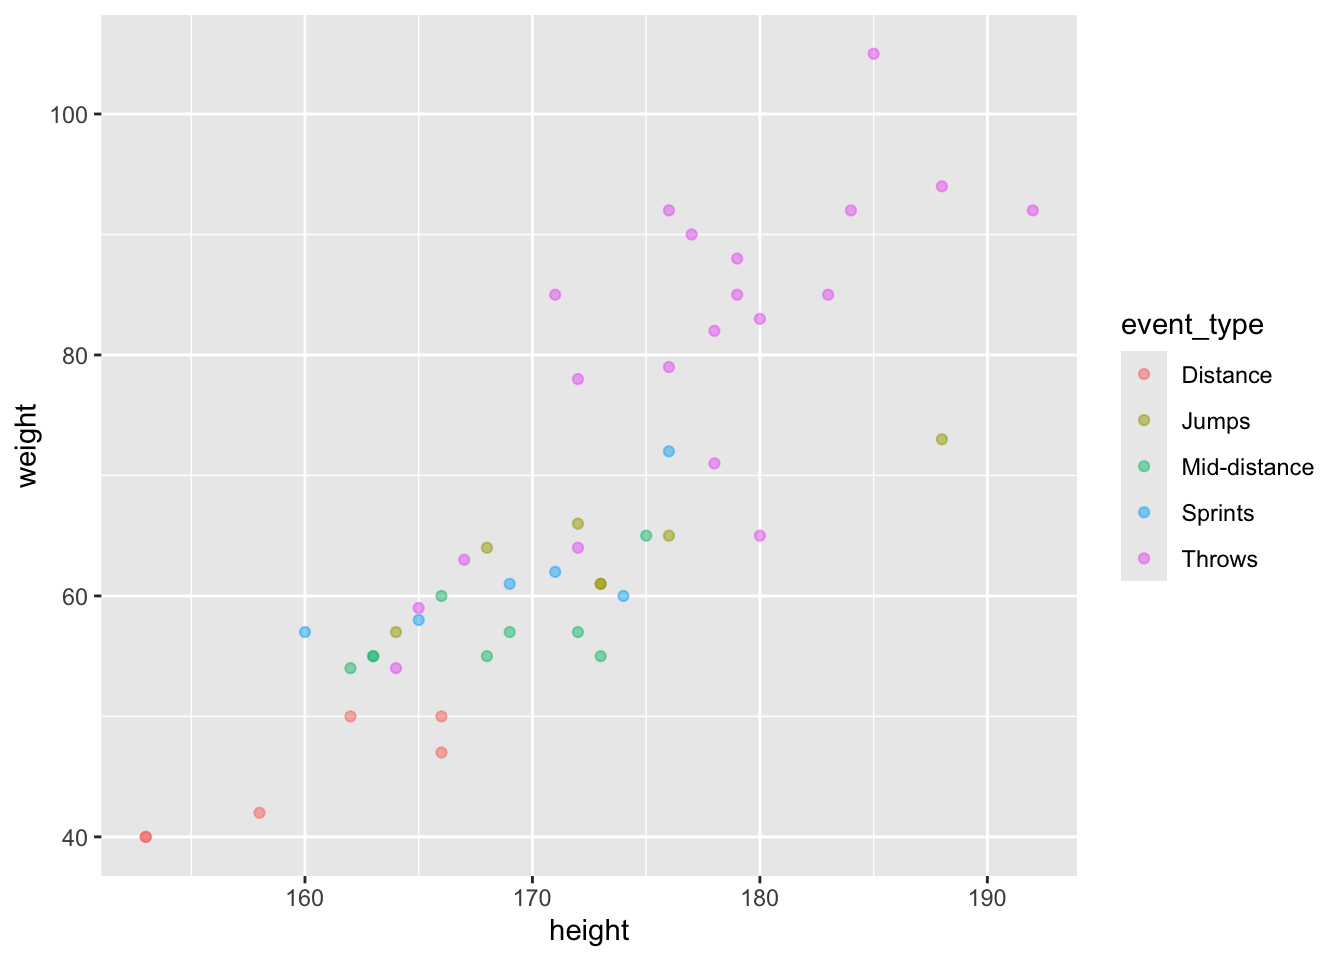
# this is still too much, let's group themathletics <- athletics %>%mutate(event_type =case_when( event %in%c("10,000 metres", "5,000 metres") ~"Distance", event %in%c("800 metres","1,500 metres") ~"Mid-distance", event %in%c("100 metres", "400 metres") ~"Sprints", event %in%c("Long Jump", "Triple Jump", "High Jump") ~"Jumps", event %in%c("Shot Put", "Discus Throw", "Javelin Throw") ~"Throws",))# now it's time to subset by sexathletics_f <- athletics %>%filter(sex=="F")athletics_m <- athletics %>%filter(sex=="M")# plot femaleathletics_f %>%ggplot(aes(height, weight, color=event_type))+geom_point(alpha=0.5)
This is a much easier graphic to understand so I decided to beautify it.
Look at the code
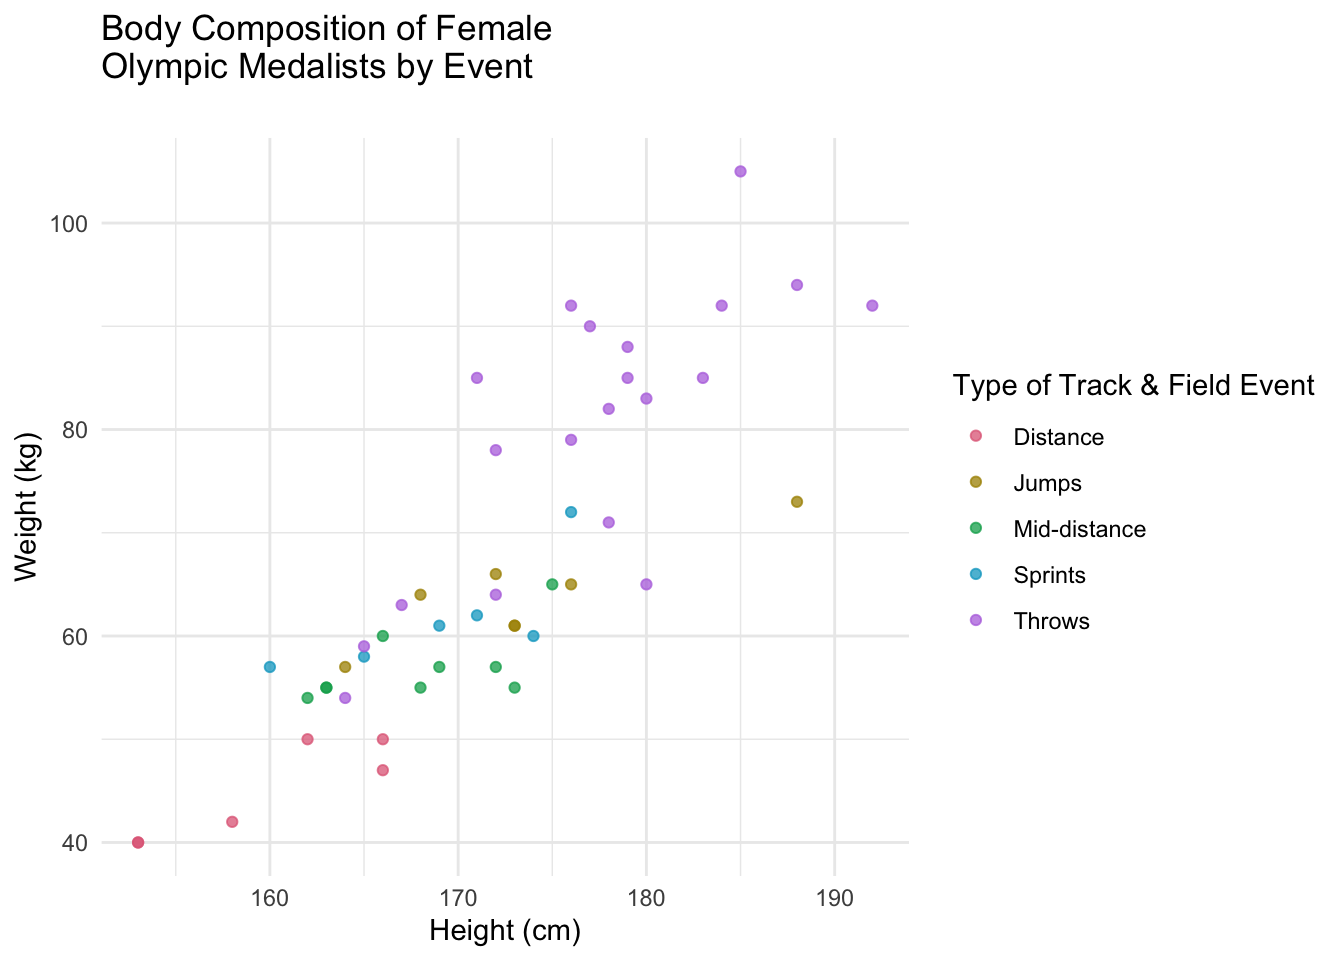
# putting it together(( p1 <- athletics_f %>%ggplot(aes(height, weight, color=event_type))+geom_point(alpha=0.75)+theme_minimal()+scale_color_discrete_qualitative("Dark 3")+labs(title="Body Composition of Female \nOlympic Medalists by Event\n", x="Height (cm)", y="Weight (kg)", color="Type of Track & Field Event") ))
The findings reveal interesting trends. Female throwers generally exhibit larger body compositions, both in terms of weight and height, while distance runners tend to be smaller and lighter compared to other athletes. Jumpers, on the other hand, show either tall stature (likely due to high jumpers) or body compositions similar to sprinters. Short sprinters demonstrate a balanced distribution without skew in either height or weight, while mid-distance runners appear slightly lighter and shorter than their short sprinter counterparts. The sprinters, as a group, exhibit similar body types, with an average height of around 170 cm and weight of 60 kg.
Look at the code
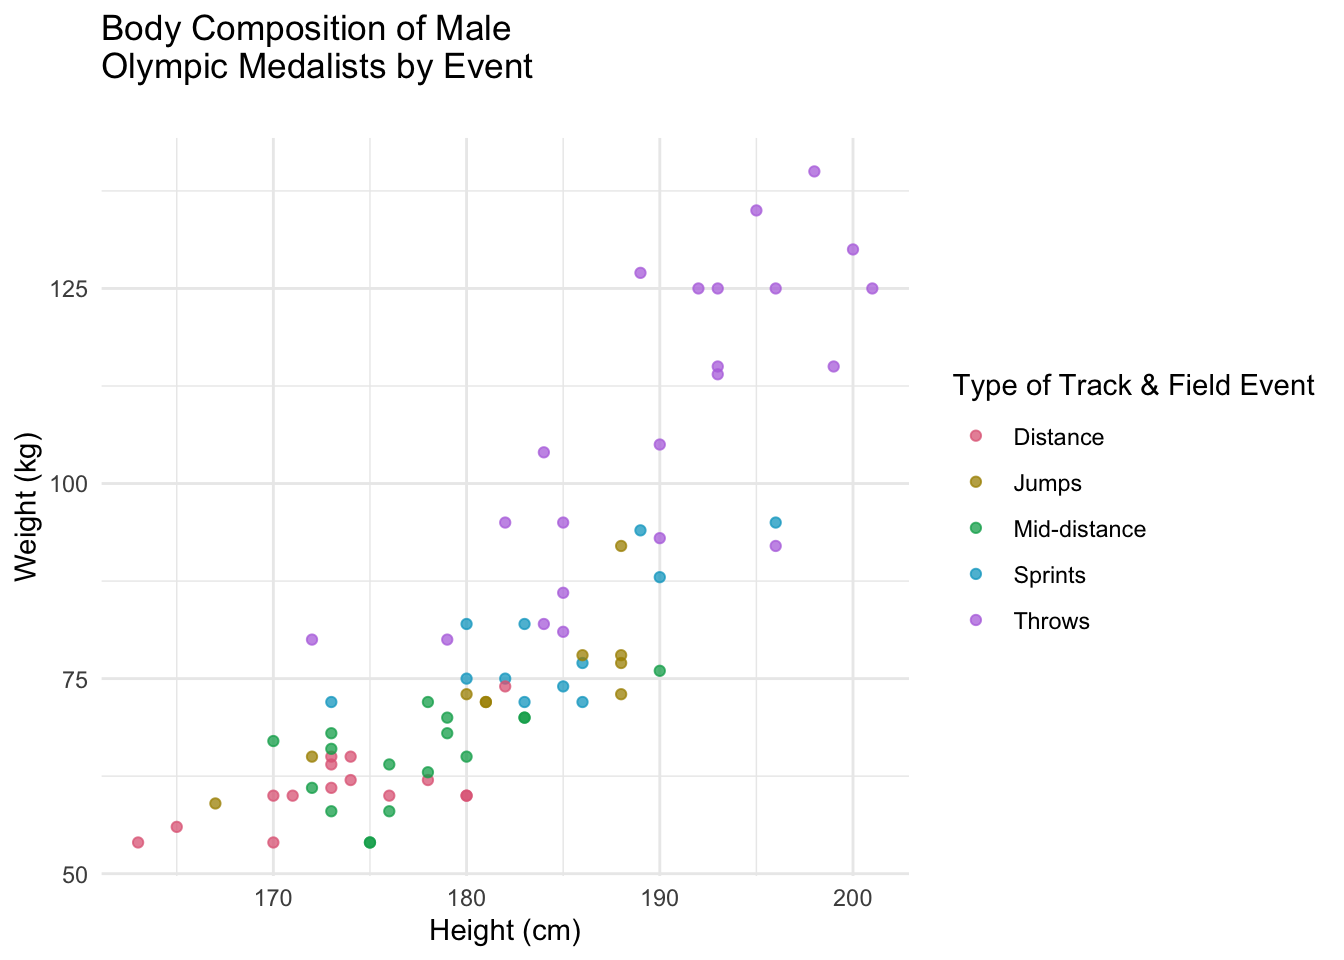
# putting it together(( p2 <- athletics_m %>%ggplot(aes(height, weight, color=event_type))+geom_point(alpha=0.75)+theme_minimal()+scale_color_discrete_qualitative("Dark 3")+labs(title="Body Composition of Male \nOlympic Medalists by Event\n", x="Height (cm)", y="Weight (kg)", color="Type of Track & Field Event") ))
Similar patterns emerge among male Olympic medalists. Throwers dominate the upper right quadrant, indicating their tendency to be taller and heavier than other athletes. Like their female counterparts, male distance runners tend to have lighter and shorter body compositions. Jumpers and sprinters showcase comparable body types, with mid-distance runners falling between short sprinters and distance runners.
Discussion
Interestingly, I was surprised to discover that throwers tend to be significantly taller than other athletes, as I initially assumed jumpers would be the tallest, given the specific demands of high jump. The realization that distance runners tend to be shorter, which hadn’t caught my attention previously, could be due to height-to-weight ratio. Being lighter appears advantageous for distance runners, and a shorter stature could contribute to achieving this goal.
These data align with my anectodal observations of track and field events. The trends indicate that specific events attract athletes with distinct body sizes, likely due to inherent advantages associated with their builds. This project has been a fun way to combine my passion for track and field with data science techniques. Please reach out if you have any project ideas or would like to collaborate.
FAQ: Olympic Body Composition Analysis
Where does the dataset come from?
The data was published as part of the TidyTuesday project (July 27, 2021) and includes Olympic athletes across many sports and years.
How were the events grouped into categories?
Events were grouped into five categories: Distance (5,000 m, 10,000 m), Mid-distance (800 m, 1,500 m), Sprints (100 m, 400 m), Jumps (long, triple, high jump), and Throws (shot put, discus, javelin).
Why focus only on medalists?
Filtering to medalists provides a focused view of athletes who reached the highest level of performance, making body composition patterns clearer.
What trends stand out between male and female athletes?
In both groups, throwers are taller and heavier, distance runners are shorter and lighter, and sprinters and jumpers cluster in between.
Can this analysis predict performance?
No. The visualizations highlight correlations but do not establish causation. Many factors beyond height and weight, such as training, technique, and physiology affect athletic outcomes.
Oliver F. Anderson, MS – Computational Biologist, Data Scientist, and Research Consultant based in Portland, Oregon. I design data-driven solutions in bioinformatics, machine learning, and AI automation for research and biotech.