ProteinWeaver: Visualizing Biological Networks in their Functional Context
ProteinWeaver, biological networks, Gene Ontology, protein visualization, molecular interaction, bioinformatics, network biology, regulatory interaction, protein protein interaction
ProteinWeaver is a web tool for exploring how proteins connect to biological pathways and processes. By combining molecular interaction data with Gene Ontology annotations, it highlights a protein’s functional context inside complex biological networks.
The project was developed at Reed College under the guidance of Dr. Anna Ritz, with collaboration from Altaf Barelvi. You can try ProteinWeaver on the official website or view the source code on GitHub.
Workflow
- Database & interaction data
- Import protein–protein, regulatory, and protein–GO term associations from curated databases.
- Standardize identifiers for consistency across datasets.
- Import into Neo4j, a graph database.
- Hosts data for seven model organisms: Arabiposis thaliana, Bacillus subtilis, Caenorhabditis elegans, Danio rerio, Drosophila melanogaster, Escherichia coli, & Saccharomyces cerevisiae.
- User query setup
- Input a protein of interest along with a Gene Ontology (GO) term.
- Choose the type of network to be displayed (Physical, Regulatory, or Both).
- Choose between two different pathfinding algorithms (Nodes and Paths).
- Adjust k (number of nodes to include in the Nodes mode or number of shortest paths to include in the Paths mode).
- Network construction
- Build a subnetwork centered around the query protein and its connections to the chosen GO term.
- Annotate edges with interaction type (regulatory or physical).
- Visualization in the browser
- Render the subnetwork interactively using Cytoscape.js.
- Display node and edge attributes, including protein names, GO terms, and interaction evidence.
- Web deployment
- Host the tool on a public server for interactive use.
- Source code is open and reproducible on GitHub.
Results

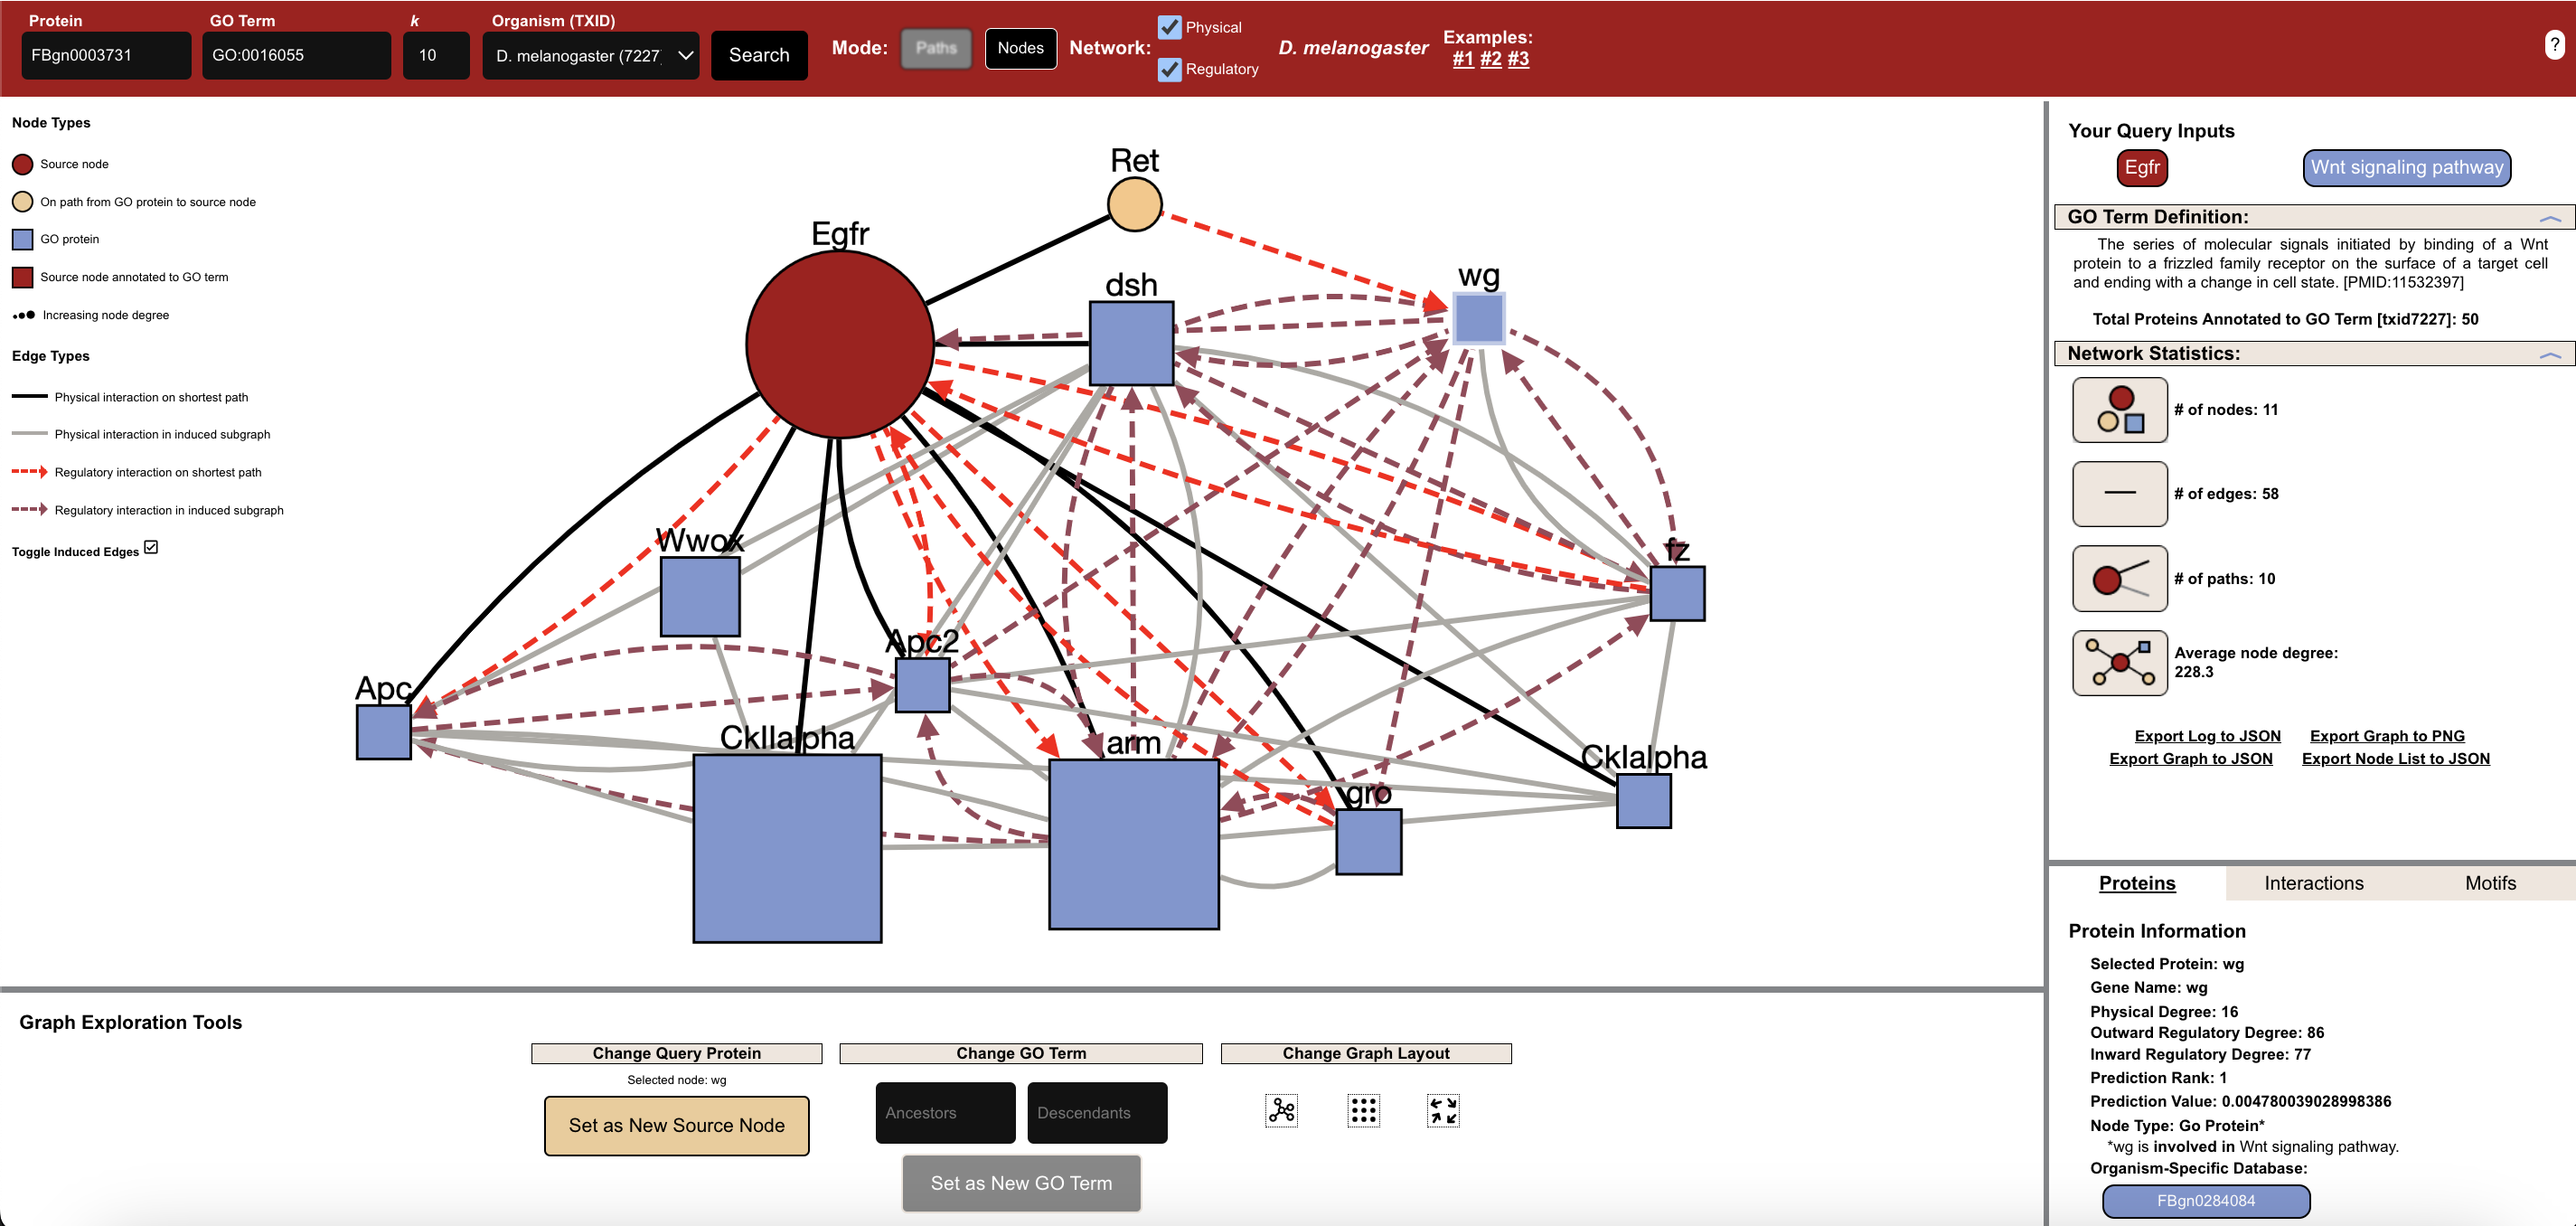
Query: Egfr + GO:0016055 (Wnt signaling pathway), D. melanogaster (7227), k=10, Nodes mode, and Mixed (both Physical and Regulatory) interactions.
Network: 11 nodes, 58 edges.
Nodes are sized based on their degrees. High-degree nodes often include key regulators and adapter proteins.
Solid, undirected edges mark protein–protein links.
Dashed, directed edges show regulatory interactions.
Red circles indicate the queried node.
Blue squares indicate proteins annotated to the queried GO term.
Yellow circles indicate proteins on the path from the source node to the GO-annotated nodes.
Discussion
ProteinWeaver makes it possible to frame proteins in terms of specific biological functions. Instead of exploring large, undifferentiated networks, users can query with a single protein and a Gene Ontology term to see how that protein connects to a process of interest within a mixed interaction network.
In practice, this approach helps identify proteins that may be assocatied with processes that they are not yet known for. For example, Ret and Egfr are not yet annotated to the “Wnt signaling pathway” GO term but could be targets for further investigation if they are connected to many proteins annotated to the GO term. This can help identify novel processes or functions for proteins.
While the tool already supports interactive exploration in the browser, the exported JSON networks also integrate smoothly with external analysis pipelines. This flexibility means ProteinWeaver can be used for hypothesis generation, quick visualization, downstream statistical modeling, or as part of larger workflows in bioinformatics projects.
This work resulted in a publication and a poster presentation:
- Presented at the RSGDREAM 2023 conference
- Published in: 👉 PLOS ONE
FAQ: Using ProteinWeaver
How does ProteinWeaver connect proteins to Gene Ontology terms?
ProteinWeaver maps proteins to GO terms using curated annotations. It then traces connections between the queried protein and proteins annotated to the queried process by building subnetworks from interaction data.
Can I export a network from ProteinWeaver?
Yes. Networks can be exported as JSON for use in Cytoscape.js or download the current network view as a PNG.
Which types of interactions are included in the network?
Networks may include protein–protein, regulatory interactions, or both. Edges can be filtered and are styled by interaction type.
Is ProteinWeaver limited to one organism?
The current deployment supports seven species (Arabiposis thaliana, Bacillus subtilis, Caenorhabditis elegans, Danio rerio, Drosophila melanogaster, Escherichia coli, & Saccharomyces cerevisiae), but each query is scoped to a single taxon at a time to avoid cross-species artifacts.
Do I need to install anything to use ProteinWeaver?
No. ProteinWeaver runs entirely in the browser.
Oliver F. Anderson, MS – Computational Biologist, Data Scientist, and Research Consultant based in Portland, Oregon. I design data-driven solutions in bioinformatics, machine learning, and AI automation for research and biotech.
Back to top